Mobile App Performance Monitoring: A Master Guide
Oct 21, 2024
Users demand fast, responsive, and seamless app experiences. Monitoring mobile app performance helps developers and companies ensure their apps meet these expectations, providing valuable insights to improve usability, engagement, and reliability. In today’s digital-first world, mobile applications play a critical role in business success.
Table of Contents
Introduction to Mobile App Performance Monitoring
Why Mobile App Performance Monitoring is Important
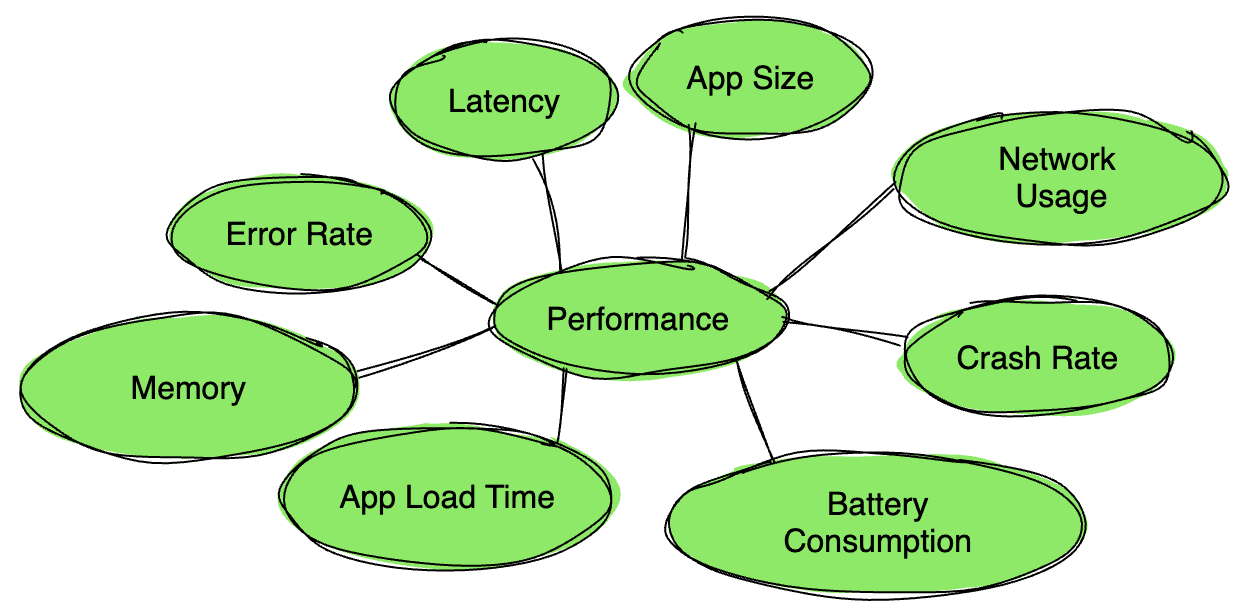
Key Metrics for Mobile App Performance Monitoring
App Crash Rate
Latency
ANR (Application Not Responding)
Network Performance
App Load Time
Battery Consumption
Memory Usage
Top 5 Third-Party Mobile App Performance Monitoring Tools
Implementing Mobile App Performance Monitoring
Using Firebase Performance Monitoring
Custom Performance Monitoring with Code Snippets
Conclusion
Common FAQs About Mobile App Performance Monitoring
Why Mobile App Performance Monitoring is Important
Performance monitoring is the backbone of maintaining high-quality mobile applications. It helps you:
Identify Bottlenecks: Detect slow app performance, crashes, and lags.
Enhance User Experience: Improve loading times and interactions, resulting in satisfied users.
Boost Retention: Apps with optimal performance lead to increased user retention rates.
Optimize Resources: Allocate server and development resources effectively by analyzing app behavior.
Key Metrics for Mobile App Performance Monitoring

Tracking the right metrics is crucial for understanding the performance of your mobile app and identifying areas that need improvement. Let’s dive deeper into each of the critical metrics for mobile app performance monitoring.
1. App Crash Rate
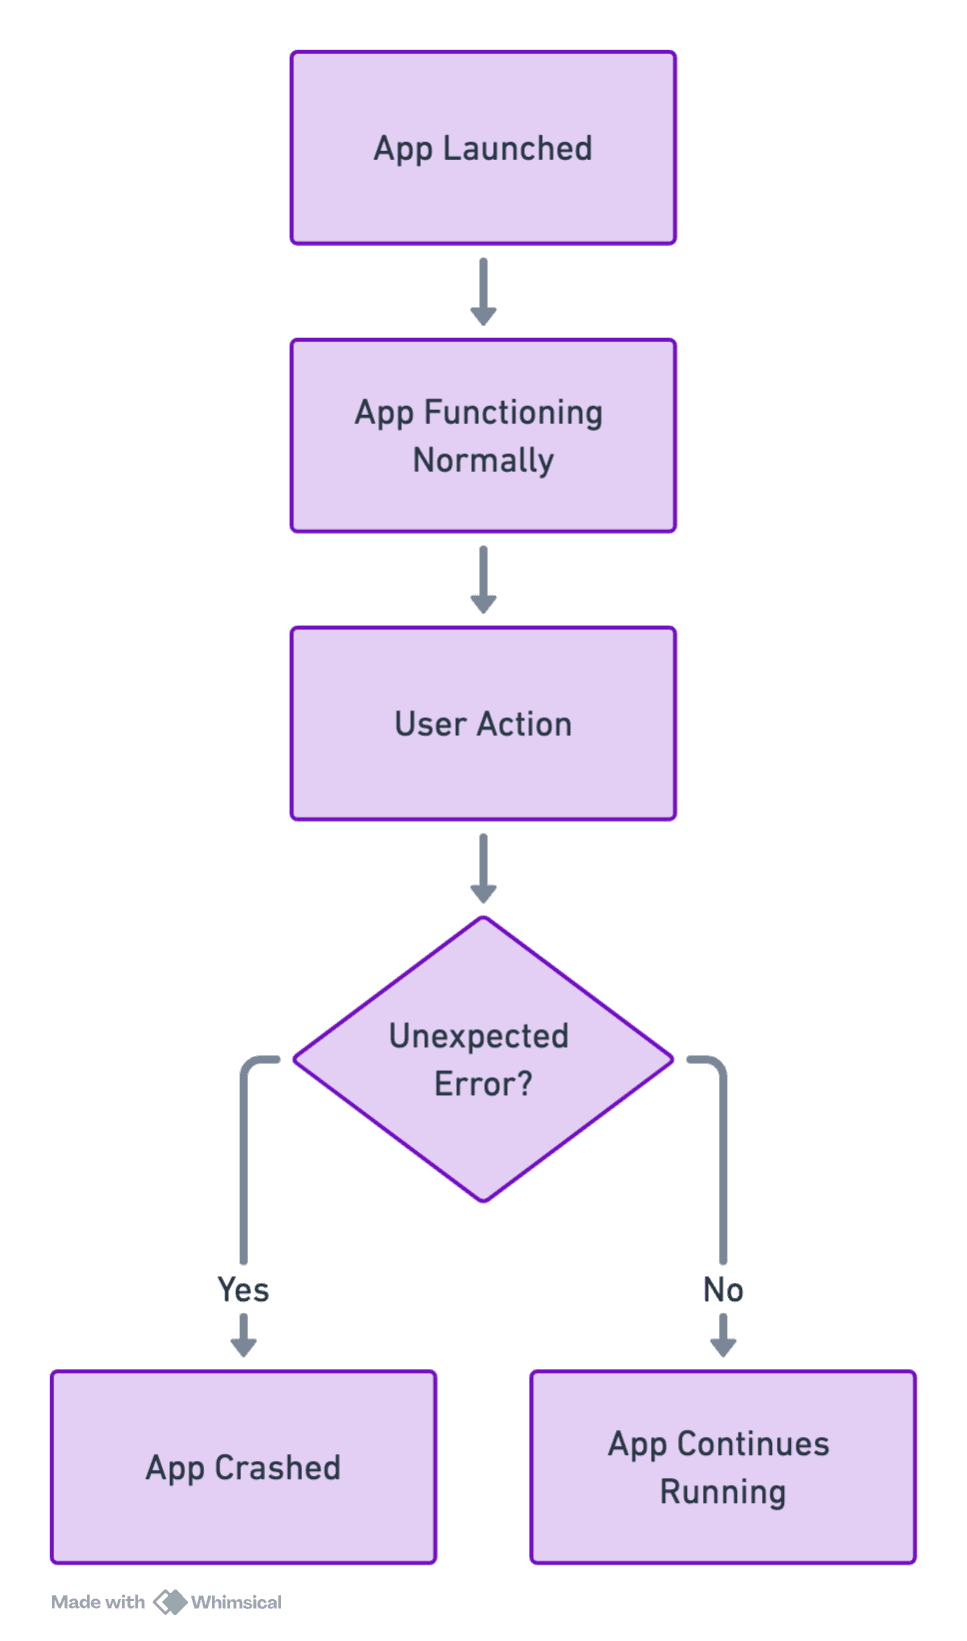
Definition: The app crash rate is the percentage of app sessions that end in a crash. It is one of the most visible and impactful indicators of app performance because a crashing app is immediately disruptive to the user experience.
How to Measure:
Use tools like Firebase Crashlytics or New Relic to monitor crash rates. Formula -
Crash Rate (%) = (Number of Crashes / Number of App Sessions) * 100
Best Practices to Reduce Crash Rates:
Thorough Testing: Use automated testing frameworks like Appium or Espresso to simulate multiple scenarios.
Monitor Dependencies: Outdated third-party libraries or SDKs can cause crashes.
Optimize Memory Usage: Memory leaks are a common cause of crashes. Use tools like Android Profiler or Instruments for iOS to monitor and fix memory issues.
Benchmark: Industry standards suggest keeping the crash rate below 1-2% for a good user experience.

2. Latency
Definition: Latency refers to the time taken for the app to respond to user actions, such as opening a screen, loading content, or completing a task like making a payment.
Types of Latency:
UI Latency: Time taken to render UI components after user interaction.
Network Latency: Time taken for API requests and responses.
How to Measure:
Use tools like Firebase Performance Monitoring or Charles Proxy to capture response times.
Code example for tracking latency (Kotlin):
Best Practices to Reduce Latency:
Optimize Network Requests: Use techniques like caching and pagination.
Reduce Asset Sizes: Compress images, minimize file sizes, and use lightweight libraries.
CDNs: Leverage Content Delivery Networks to reduce data transfer time.
Benchmark: Network latency should be under 200ms for optimal user experience.
3. ANR (Application Not Responding) Rate
Definition: ANRs occur when the app stops responding to user inputs for a significant period (typically 5 seconds or more). These events lead to poor user experience and app uninstalls.
Common Causes:
Long-running tasks on the main thread.
Deadlocks caused by improper synchronization.
Excessive database queries or I/O operations.
How to Measure:
Android Studio automatically detects ANRs during testing.
Firebase also provides ANR insights in its performance monitoring dashboard.
Best Practices to Prevent ANRs:
Avoid Blocking Main Thread: Minimize time-intensive operations on the UI thread.
Use Async Techniques: Implement AsyncTasks, Coroutines, or RXJava for better responsiveness.
Offload Work: Use background threads for heavy tasks. For example:
4. Network Performance
Definition: Network performance involves measuring the quality and speed of data transfer between the app and the server. Slow or unreliable network performance leads to frustration, especially for data-intensive apps.
Key Metrics for Network Performance:
Response Time: Time taken for a server to respond to an API call.
Throughput: The amount of data transmitted over a network in a specific time frame.
Error Rate: Percentage of failed API calls.
How to Measure:
Use tools like Firebase Performance Monitoring, Postman, or Charles Proxy to monitor API calls and their performance.
Best Practices to Optimize Network Performance:
Minimize Requests: Batch API calls instead of making multiple small requests.
Enable Compression: Compress data before sending over the network (e.g., Gzip compression for HTTP responses).
Monitor and Retry: Implement exponential backoff strategies for failed network requests.
5. App Load Time

Definition: The time it takes for the app to launch and display its main screen. This is a critical first impression metric.
How to Measure:
Measure from the app’s initialization to the rendering of the first screen.
Use the System.currentTimeMillis() function in your app’s entry point.
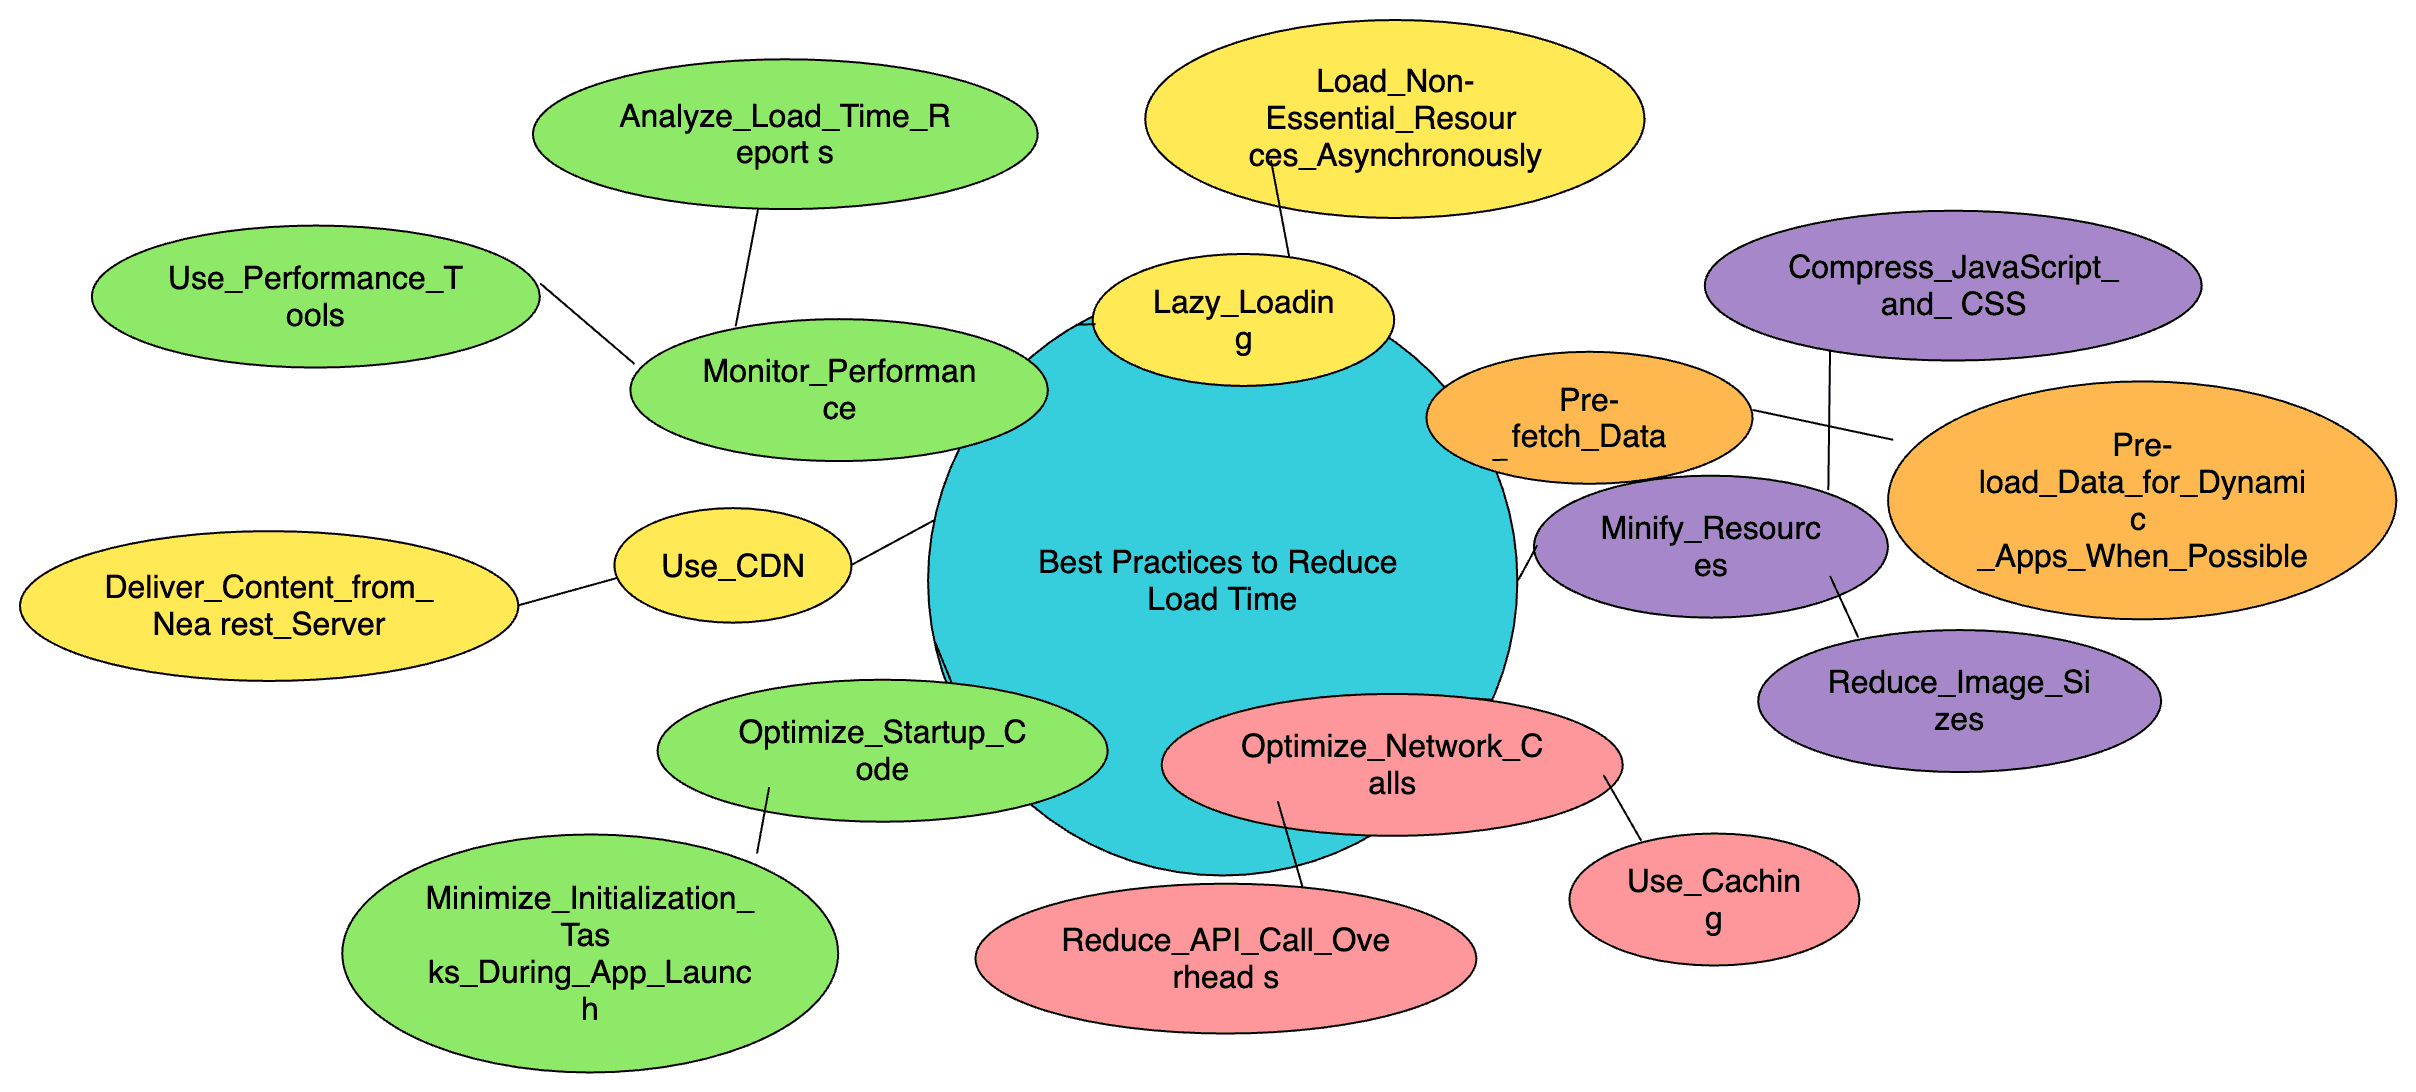
Best Practices to Reduce Load Time:
Lazy Loading: Load non-essential resources asynchronously.
Optimize Startup Code: Minimize initialization tasks during app launch.
Pre-fetch Data: For dynamic apps, pre-load data when possible.
Benchmark: Keep load times under 2 seconds for better user engagement.
6. Battery Consumption

Definition: Excessive battery usage is a major reason users uninstall apps. Monitoring energy consumption helps identify inefficient code or background processes.
How to Measure:
Use tools like Android Profiler or Xcode Energy Logs.
Monitor processes that consume significant CPU, GPU, or network resources.
Best Practices to Optimize Battery Usage:
Minimize Background Activity: Schedule non-essential tasks using tools like WorkManager.
Efficient Resource Usage: Avoid unnecessary wake locks or GPS usage.
7. Memory Usage

Definition: Inefficient memory management can lead to crashes, slow performance, and user frustration.
How to Measure:
Android: Use Memory Profiler.
iOS: Use Instruments (Allocation Tool).
Best Practices:
Avoid Memory Leaks: Identify leaks using tools like LeakCanary.
Optimize Images: Use lower resolution images or compressed formats.
Garbage Collection: Ensure unused objects are de-referenced.
Tracking and improving these metrics ensures a smoother and more engaging app experience for your users, reducing uninstalls and boosting retention. With continuous monitoring and optimization, you can maintain a high-quality app that stands out in a competitive marketplace. Would you like further examples or tools for specific metrics?
Top 5 Third-Party Mobile App Performance Monitoring Tools
1. Firebase Performance Monitoring
Firebase offers powerful tools for real-time app monitoring, including crash analytics, network monitoring, and user session insights. Visit Firebase
2. New Relic Mobile
New Relic Mobile provides a detailed breakdown of app performance with crash analysis, interaction traces, and custom metrics. Visit New Relic
3. AppDynamics
A leading solution that provides end-to-end app performance visibility, including user interactions and backend health. Visit AppDynamics
4. Instabug
Instabug focuses on user feedback and crash reporting with advanced tools for monitoring and debugging. Visit Instabug
5. Dynatrace
Known for AI-powered insights, Dynatrace ensures mobile apps perform optimally by monitoring crashes, network requests, and UX metrics. Visit Dynatrace
Implementing Mobile App Performance Monitoring
Let’s explore two approaches: using Firebase Performance Monitoring and custom performance monitoring code.
a. Using Firebase Performance Monitoring
Firebase allows you to integrate performance monitoring with minimal effort.
Step-by-Step Integration:
Add Firebase SDK to your project.
Enable Performance Monitoring in the Firebase console.
Add custom trace codes to measure specific app processes.
Example Code (Android):
b. Custom Performance Monitoring with Code Snippets
Custom monitoring gives granular control over metrics. Below is an example of tracking API latency in a mobile app.
Example Code (iOS - Swift):
Example Code (Android - Kotlin):
Conclusion
Mobile app performance monitoring is indispensable for maintaining user satisfaction and app quality. From tracking key metrics to integrating powerful third-party tools, effective monitoring provides a clear pathway to improving app performance. By leveraging tools like Firebase, New Relic, or Dynatrace, you can ensure that your app remains robust and user-friendly.
Start optimizing your app today and stay ahead in the competitive mobile market!
Frequently Asked Questions
1. What is the difference between crash reporting and performance monitoring?
Crash reporting focuses on identifying and analyzing app crashes by capturing stack traces, error logs, and user sessions leading up to a crash.
Performance monitoring, on the other hand, tracks overall app health, including metrics like latency, ANRs, network calls, and resource usage. Both are essential for a comprehensive app maintenance strategy.
2. How often should I monitor my app’s performance?
App performance should be monitored continuously to detect and resolve issues proactively. Automated tools like Firebase or New Relic provide real-time monitoring to ensure consistent performance.
3. What are the common tools for ANR (App Not Responding) tracking?
Firebase Performance Monitoring: Tracks ANRs along with crash analytics.
Android Studio Profiler: Detects ANRs during development.
XCode Instruments Profiler: Profile and Instrument ANRs during development.
Instabug: Provides detailed ANR reports and user session insights.
4. What role does user feedback play in performance monitoring?
User feedback is invaluable for uncovering performance issues that monitoring tools might not catch, such as slow UI transitions or frustrations caused by minor bugs. Tools like Instabug or Qualtrics can help integrate feedback loops directly into your app.
5. What is a good retention rate for a mobile app?
Retention rates vary by industry, but a general benchmark is:
Day 1 Retention: 30-40%
Day 7 Retention: 15-25%
Day 30 Retention: 5-10%
A low retention rate may indicate performance issues like crashes, slow load times, or excessive battery usage.
6. How do I test my app under different network conditions?
Simulate network environments such as 3G, 4G, 5G, or Wi-Fi using tools like:
Network Link Conditioner (iOS)
Throttle Network Speed option in Android Emulator
Third-party tools like Charles Proxy for controlled network testing.
7. How can I optimize the app’s startup time?
Minimize Initialization Tasks: Load only critical components during startup.
Lazy Load Resources: Delay loading non-essential resources until after the app’s UI is rendered.
Reduce API Calls: Combine or cache data fetched during the startup process.
8. How does performance monitoring differ for iOS vs. Android apps?
While the core principles remain the same, the tools and frameworks often differ:
iOS: Instruments (Xcode), Firebase, or Instabug for crash reporting and performance monitoring.
Android: Android Profiler, Firebase, or Dynatrace for detailed insights.
9. What is the impact of app size on performance?
Large app sizes can lead to:
Longer Download Times: Especially for users on slower networks.
Higher Uninstall Rates: Users may uninstall apps that consume too much storage.
Solution: Use techniques like resource shrinking, image compression, and modular app architectures.
10. How can I monitor performance for hybrid apps like those built with Flutter or React Native?
Use platform-specific tools like Firebase or Sentry, which support both native and hybrid frameworks.
Integrate performance monitoring plugins like React Native Performance or Flutter Performance Monitoring from popular packages.
11. What is the role of A/B testing in performance optimization?
A/B testing helps evaluate changes in app performance based on user behavior. For instance:
Testing different image sizes for faster load times.
Evaluating impact on retention after implementing a new caching strategy.
Tools like Firebase A/B Testing or Optimizely are excellent for running performance-related experiments.
12. What are the common signs of poor app performance?
High crash rates or frequent ANRs.
Slow load times for screens or API responses.
Negative app store reviews mentioning performance issues.
Increased uninstallation rates after updates.
13. How do I monitor app performance across different devices and OS versions?
Use cloud-based testing platforms like BrowserStack or Sauce Labs to run your app on multiple devices and OS combinations.
Regularly test on older devices or OS versions to ensure compatibility.
14. Can monitoring tools track battery and memory usage?
Yes, most advanced monitoring tools track battery and memory usage. Examples:
Android Profiler: Monitors energy and memory consumption on Android devices.
Xcode Instruments: Tracks battery and memory usage for iOS apps.
15. What is the role of backend performance in mobile app monitoring?
Backend performance directly affects app responsiveness and user experience. Key backend metrics include:
API Latency: Server response times.
Uptime: Server availability during user requests.
Error Rates: Frequency of server-side errors impacting the app.
Monitor backend performance with tools like Postman, New Relic, or Dynatrace.
16. How do I prioritize performance issues?
Categorize issues based on their impact and frequency:
High Impact, High Frequency: Address immediately (e.g., critical crashes).
Low Impact, High Frequency: Plan for regular updates (e.g., minor UI lags).
Low Impact, Low Frequency: Monitor and address as resources allow.
17. Can I automate app performance monitoring?
Yes, tools like Firebase, New Relic, and Dynatrace provide automated monitoring and alert systems for performance issues, including crashes, network latency, and ANRs.
18. How do updates impact app performance?
Updates can introduce new bugs or fix existing ones. Always monitor metrics like crash rates, retention, and user feedback after an update to assess its impact.
19. How does app performance affect app store rankings?
Poor app performance leads to negative reviews, which directly lower app store rankings. Regular monitoring and optimization ensure higher ratings and better visibility.
20. What’s the difference between frontend and backend performance monitoring?
Frontend Monitoring: Focuses on the app’s user interface and client-side processes, such as UI responsiveness, load times, and crash rates.
Backend Monitoring: Tracks server-side metrics like API latency, database performance, and server uptime.
Both are essential for a holistic view of app performance.
